 Soil Nutrient Management
SOIL 4234

Soil Nutrient Management
Lectures
Introduction
Chapter 1
River Boat Gamblers editorial
Chapter 2
Nutrient Deficiency Powerpoint
Chapter 3
Table of Elements
Conjugate Bases and Acids Wikipedia Link
Concentration handy PP slide
Calculating Ksp Purdue
Chapter 4
Chapter 5 Nitrogen
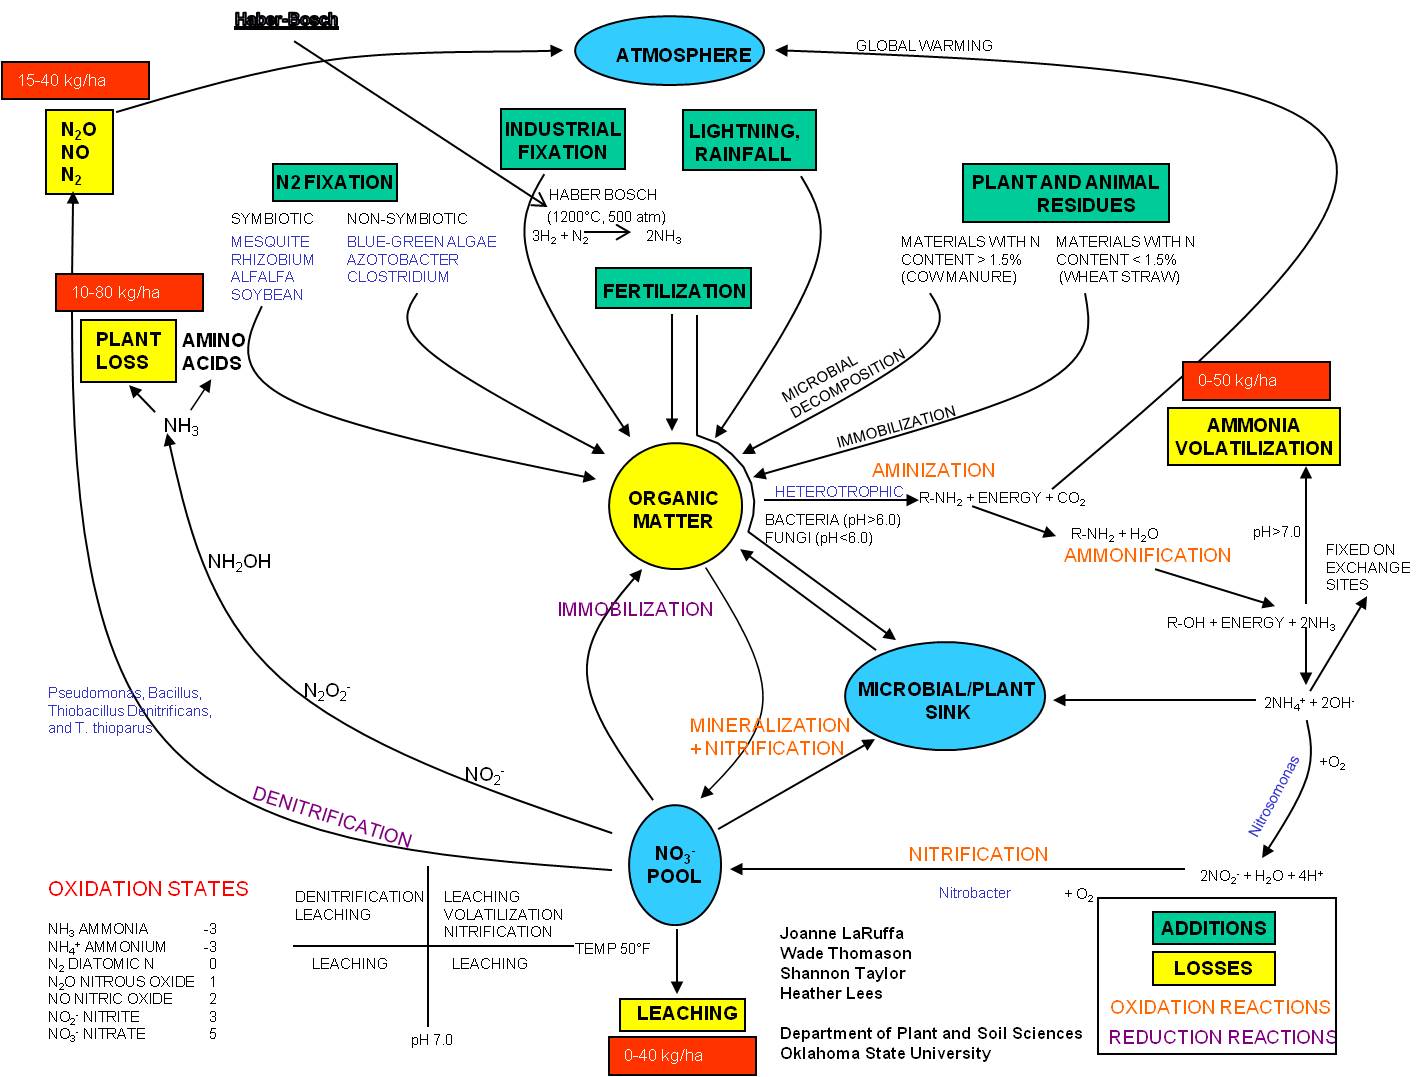
Nitrogen Cycle PowerPoint JPEG
Chapter 6 Phosphorus
Phosphorus Technology and Manufacturing IPNI
Fertilizer Calculations
Practice Problems Word Answers Word
KSU Fertilizer Excel
OSU Fertility Recommendations Word (Soil Fertility Handbook excerpt)
OSU Soiltesting Online Program http://www.soiltesting.okstate.edu/Interpretation.htm
Chapter 7 Potassium
Potassium Technology and Manufacturing IPNI
Chapter 8
GreenSeeker updated 11-26-12
Zones, Grid, EC
Field Maps HY
Field Maps EC
Field Maps REC 4
Guest Lectures
2012 Bill Raun (OSU Soil Fertility) 8-29-12, 11-12/14-12, Soil Fertility's International Impact, Advancements in Soil Fertility Research.
Dr. Bruce Dunn 10-22-12 Soil Fertility in Horticulture: Slides, Handout1, Handout2
Chrissie A. Segars 10-24-12 Soil Fertility in Turf:
2011
Bill Raun (OSU Soil Fertility) 8-24-11 Soil Fertility's International Impact
PaSS GSO 8-26-11 Graduate Student Perspective
Jason Warren (OSU Soil and Water Conservation) 10-5-11 N Fertilization impact on CO2 and N2 emissions.
Van Schuermann (WB Johnston Regional Manager) 10-17-11 Soil Fertilities impact on Wheat Industry.
Chad Godsey (OSU Cropping Systems Specialist) 11-9-11 Nutrient Cycling in No-Till
Joe Armstrong (OSU Weed Science) 11-11-11 Soil and Herbicide
Past
Chad Godsey (OSU Cropping Systems Specialist)
Bill Raun ( OSU Soil Fertility) 11-1-10 Link
Agustin Bianchini (AAPRESID No-Till Farmer's Argentinean Association) 11-5-10 Presentation
Justin Moss (OSU Turf Grass Specialist) 11-19-10 Presentation
Agustin Bianchini, AAPRESID, Argentina
Agustin Bianchini, AAPRESID, 2008
AAPRESID Video
Dr. Gordon Johnson
Phosphorus Behavior in Soils
Banding P in Alfalfa
www.fao.org
Assignments
Reading Assignments
Nature Series
Ag Monitoring,
Feeding 1,
Feeding 2,
Global,
Regulations,
Industry, Roots
No-till
Development and Current Status of No-till Adoption in the World
The spread of Conservation Agriculture: Justification, sustainability and
uptake
Profitability Homework
,
Soil Test Assignment
2010
Past years
SOIL Samples 2007
soil tests 2008
Class Results 2008
Soil Samples 2009
Nitrogen Cycle (Ninja Card)
Fertilizer Calculations
Graduate Student Assignments
Extension Publication (can do as a team no more than 2 students per
team)
Outline for Ext.
Publication
Links
Plant Nutrition and Symptomology
Visual Deficiency
Symptoms Plant phys 5.1
International Plant Nutrition Institute (IPNI)
Mosaic Back to the
Basics Web
Relevant Educational topics
Review of ELEMENTS and ATOMS
Articles and Links of Interest
Greenhouse gas mitigation by
agricultural intensification
Fertilization and Environment IPNI
Corn versus Tequila
Earth Picture
National Geographic Soils Quiz
Current World
Population
Planet Crumbles While
We Are Off Fighting Terror
http://www.geoflow.com/wastewater/turf.htm
http://grounds-mag.com/mag/grounds_maintenance_effluent_water_positive/
OSU Links
www.nue.okstate.edu
www.npk.okstate.edu
Extension Presentations
link
www.pass.okstate.edu
Federal and International
Food and Agriculture Organization
of the United Nations (FAO)
National Agricultural Statistics Service
(NASS)
|
Consumption of
World’s Nat. Resources Worlds Population World’s Waste generated ----------------------------------------- % ------------------------------------------------- Developed 66 20 75 Developing 34 80 25 (United Nations) Americans and Europeans together spend $17 billion a year on pet food, $4 billion more than the estimated yearly additional amount needed to provide everyone in the world with basic health and nutrition.
27 Million Golfers in the USA 24.3 Billion
dollars spent on golf in 2004 ($888/person/year) Food Quality, Environmental Safety: Afforded luxury in the developed world
Risk
|

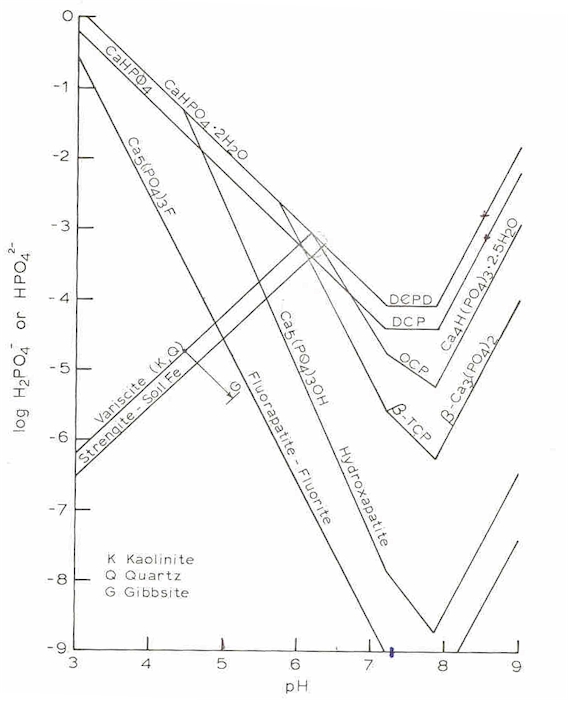
Variscite (AlPO4·2H2O,
hydrated
aluminum
phosphate)
Strengite (Fe+++PO4·2(H2O))
Deficiency Symptom
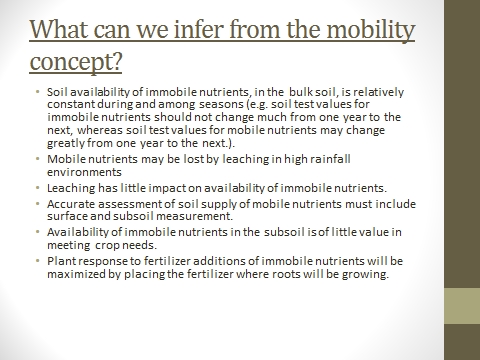
Element Mobility Mobility Form taken
up
Soil Plant by Plants
____________________________________________________________________________________
overall chlorosis seen N Nitrogen
Yes Yes NO3-,NO2-,NH4+
first on lower leaves
purple leaf margins P Phosphorus No Yes HPO4=,H2PO4-,H3PO4
chlorotic leaf margins K Potassium
No Yes K+
uniform chlorosis, stunting
(younger leaves) S Sulfur Yes Yes(no) SO4=,SO2*
N*S interaction
stunting - no root
elongation Ca Calcium
No No Ca++
interveinal chlorosis,
veins remain green Fe Iron No (ls) No Fe+++,Fe++
interveinal chlorosis Mg Magnesium No (ls)
Yes/No Mg++
reduced terminal
growth = chlorotic tips B Boron (NM) Yes No H3BO3°
interveinal chlorosis Mn Manganese
No No Mn++,
Mn+++
wilting, chlorosis, reduced
root growth Cl Chlorine
Yes Yes Cl
-
young leaves, yellow &
stunted Cu Copper No (ls)
No Cu++
interveinal chlorosis in
young leaves Zn Zinc No (ls)
No Zn++
interveinal chlorosis, inner leaf
purple blotches
stunting Mo Molybdenum Yes/No(ls) No MoO4=
dark green color Na Sodium No(ls) Yes Na+
C
Carbon CO2
H
Hydrogen H2O
O
Oxygen H2O
____________________________________________________________________________________
*absorbed through plant leaves
(NM) Non Metal
(ls)
Low Solubility
Mo availability increases with soil pH, other micronutrients show the
opposite of this.
Immobile nutrients in plant; symptoms of deficiency show up in the younger
leaves.
Stage of growth when deficiency symptom is apparent = later stage
| 1 inch of water = 226,610 lbs water/acre |
| = 27,171 gallons |
| 1 gallon of water = 8.34 lbs |
Turf Example
Green construction:
1. Totally cored the greens out and replaced them with sand to USGA specs.
2. During the grow in process of these greens, they could not get a nitrogen
response to the newly seeded bent.
3. They tried spoon feeding the greens with micronutrients to see what the
deficiency was but didn't get a nitrogen response until they applied gypsum.
4. Since gypsum is neutral, the pH should not have been a factor, and the
irrigation water quality is good so saline or sodic soil should not be
either.
5. What was the problem.
Corn
1200 kernels/pound
1 bu = 56 pounds
1 bu = 1200 * 56 = 67200 seeds
20% volunteer 227 plants = 44 plants volunteer
row spacing = 36"
30 m of row = 98.4 ft
1" furrow * 98.4 ft = 0.083*98.4 = 8.19 ft2
44 plants/8.19ft2 = x/43560 x = 234021 plants/acre = 3.5
bu/ac .... 70% germ = 5.0 bu/ac
If I could be anything in the Nitrogen Cycle
(N fixation, non-symbiotic fixation, blue-green algae, azotobacter, clostridium, symbiotic fixation, rhizobium japonicum, meliloti, trifoli, organic matter, animal and plant residues, decomposition, aminization, urea, ammonification, nitrification, oxidation, aeration, volatilization, fixation, mineralization, nitrosomonas, nitrobacter, obligate autotrophic bacteria, increased acidity, leaching, immobilization, denitrification, organic C, substrate, immobilization, plant uptake, nitrate reductase, nitrite reductase, plant N loss, N in rainfall, nitrate reduction, global warming, reduction, oxidation state)
